Beveridge-Nelson Filter Australia
DNFilter-Australia.RmdThe package includes the latest Australian real/chain volume GDP and the Unemployment Rate through to December quarter 2024.
library(bnfilter)
tail(audata)
#>           date   UNRATE  GDPC1
#> 257 2023-09-01 3.603829 649635
#> 258 2023-12-01 3.972668 650218
#> 259 2024-03-01 3.861293 651335
#> 260 2024-06-01 4.067915 652593
#> 261 2024-09-01 4.073059 654676
#> 262 2024-12-01 3.971081 658495
Load the GDP data from the package dataset

Take the logs of GDP
y <- transform_series(gdp, take_log=TRUE, pcode="p1")Example with no demeaning
plot(bnf(y=y,
         demean="nd"))
#> Warning in bnf(y = y, demean = "nd"): Setting @iterative to 0 where @demean is
#> not 'dm'.
#> Warning in matrix(data = c(1, 2), nrow = 1, ncol = 1): data length differs from
#> size of matrix: [2 != 1 x 1]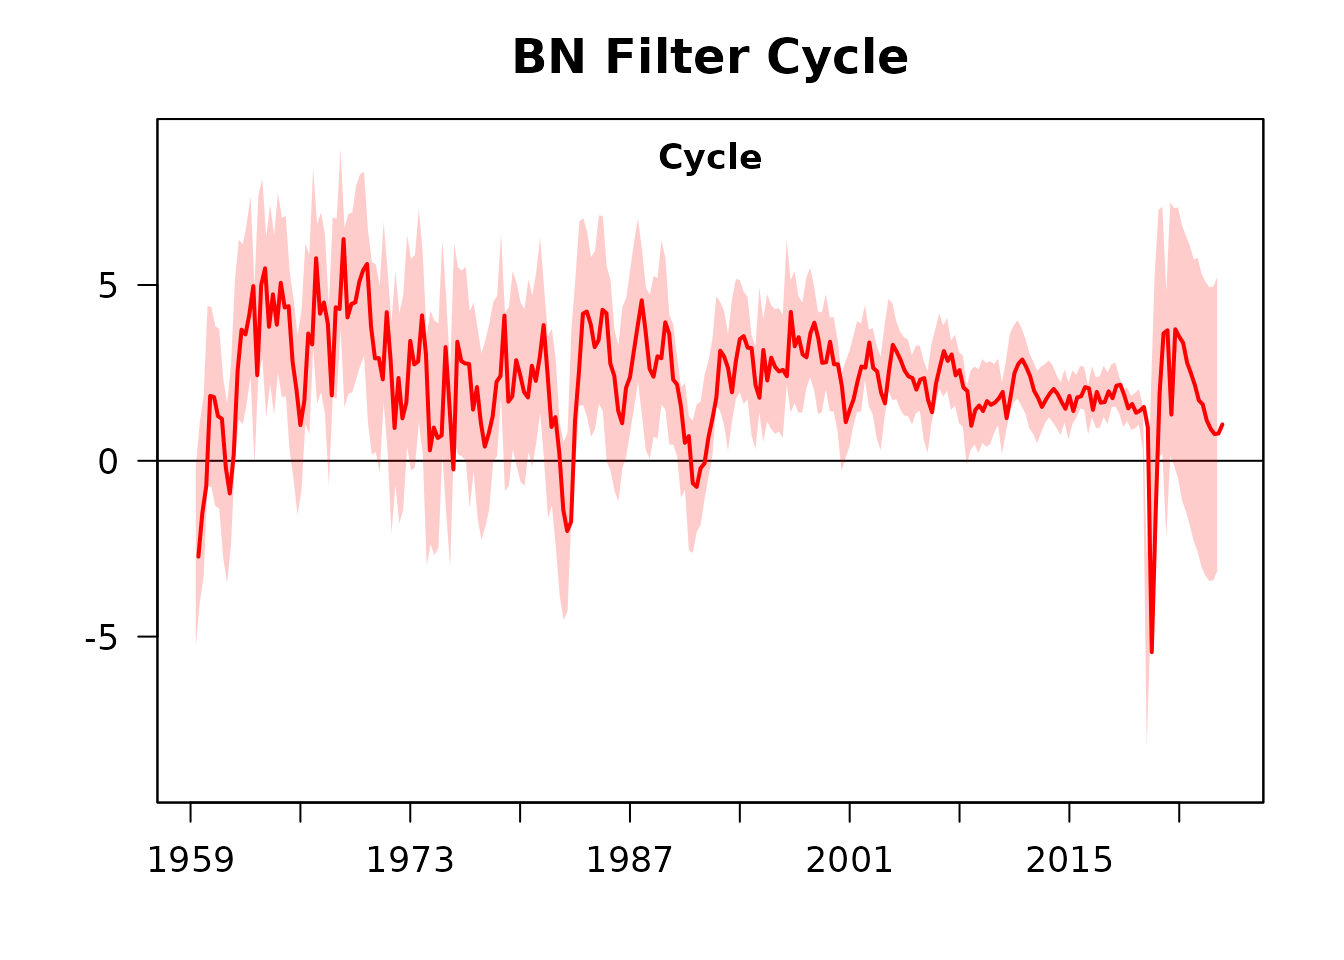
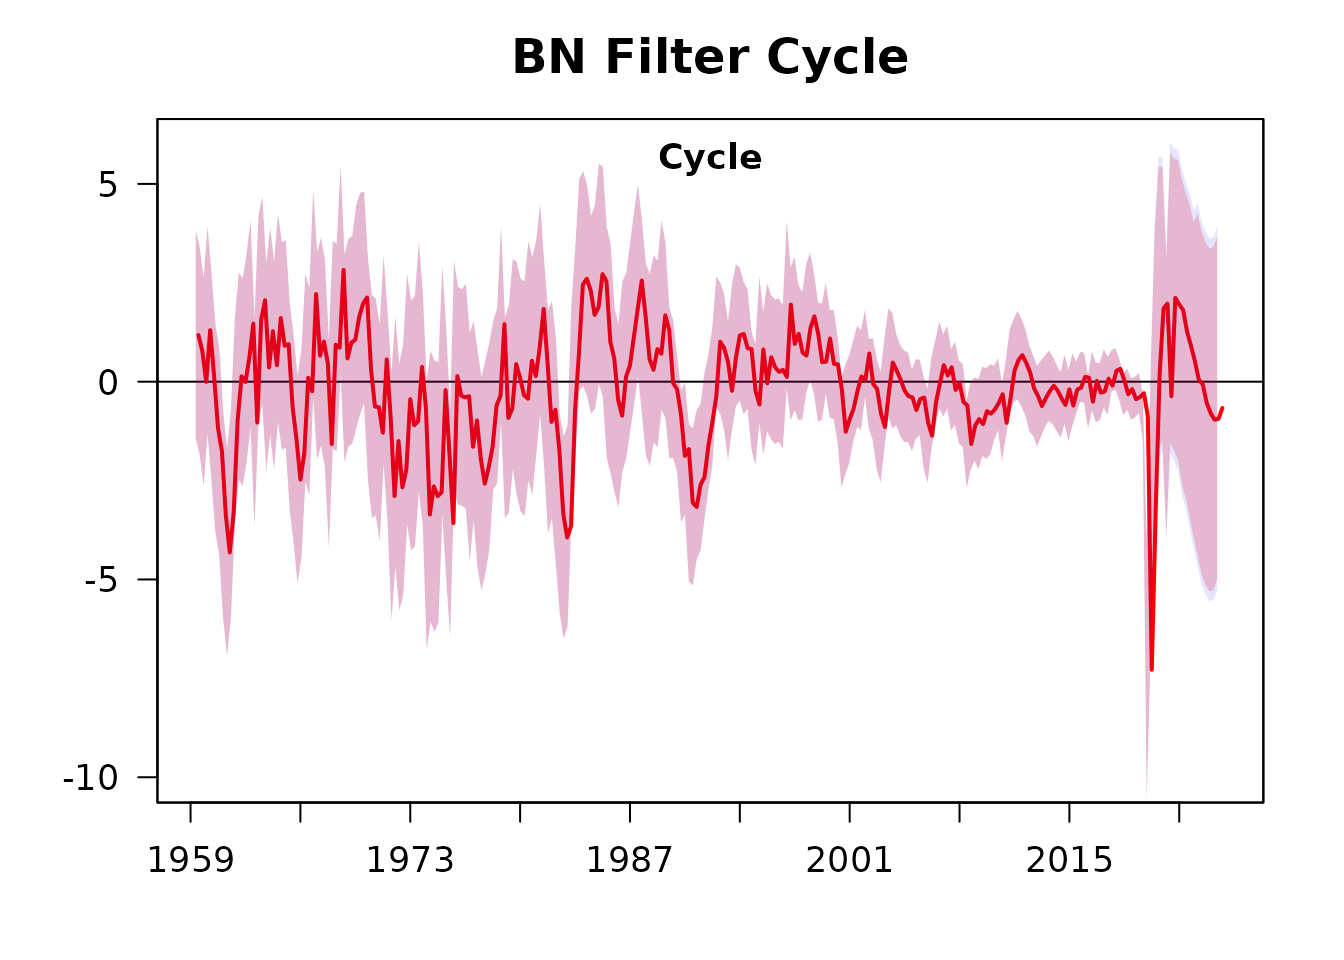
Example with dynamic demean
plot(bnf(y=y,
         demean="dm"))
#> Warning in matrix(data = c(1, 2), nrow = 1, ncol = 1): data length differs from
#> size of matrix: [2 != 1 x 1]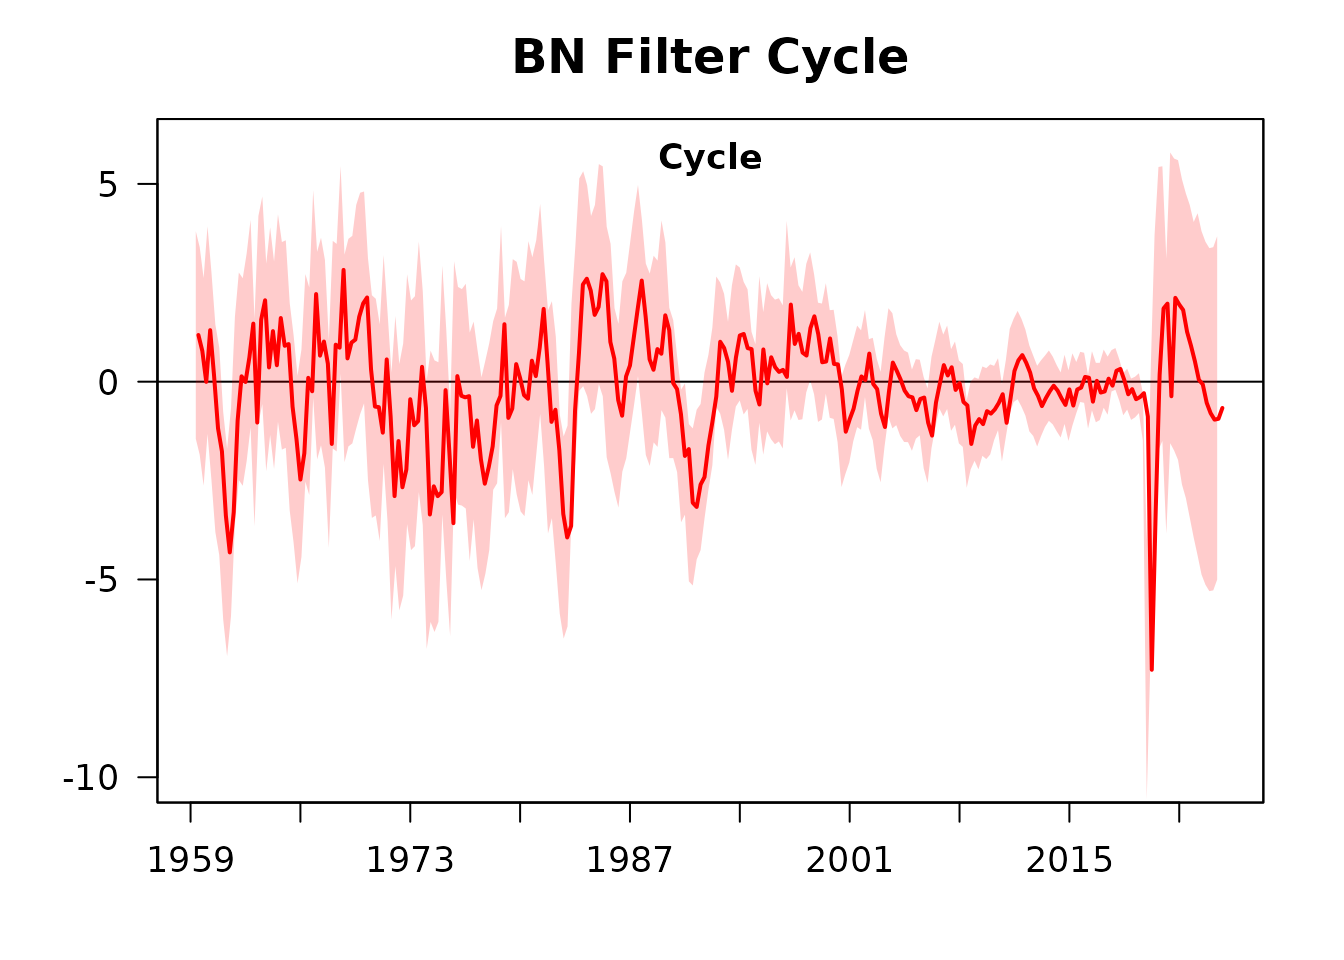
Example with dynamic adjusted confidence bands:
plot(bnf(y=y,
         demean="dm",
         dynamic_bands = TRUE))
#> Warning in matrix(data = c(1, 2), nrow = 1, ncol = 1): data length differs from
#> size of matrix: [2 != 1 x 1]
Example removing outliers for June and September quarters 2020 (COVID19):
plot(bnf(y=y,
         demean="dm",
         adjusted_bands = TRUE,
         outliers = c(244,245)))
#> Warning in matrix(data = c(1, 2), nrow = 1, ncol = 1): data length differs from
#> size of matrix: [2 != 1 x 1]